Streaming is maturing and along with it consumers want better discovery and bundles that aggregate multiple services for them. Nielsen’s first-ever report combining both streaming and linear viewing reveals that Americans are watching 18% more video than a year ago and that the TV remains the main place they are doing so.
The “State of Play” report leverages Nielsen TV measurement and streaming data, insights from Nielsen-owned Gracenote, and findings from an online custom survey of US video streamers.
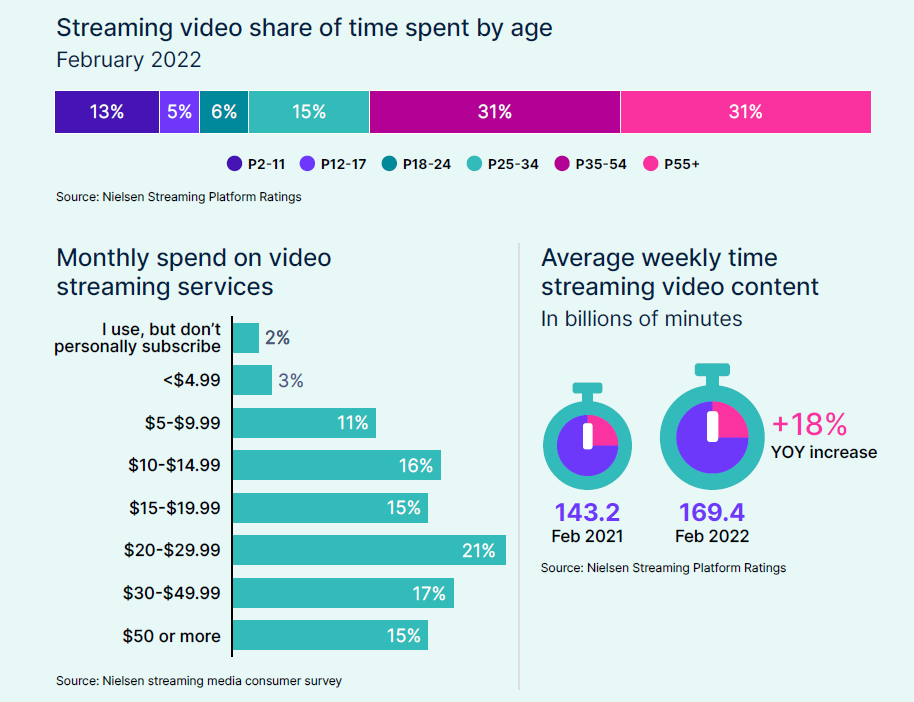
Overall, Americans increased their average weekly time streaming video by 18%, with a year-over-year increase from 143.2 billion streamed minutes to 169.4 billion between February 2021 and February 2022.
The report provides another key takeaway: streaming service consumption is expected to grow, with 93% of Americans reporting they will increase their paid streaming services or make no changes to their existing plans over the next year.
“This data stands somewhat opposed to market expectations by many, such as Deloitte, of significant churn as the streaming wars escalate,” says Brian Fuhrer, SVP, Product Strategy, Nielsen.
“We’ve moved from infancy into adolescence, and all the complexities that one would expect at that point. It’s not just that streaming is increasing year over year. Now consumers want access simplified and the explosion of services has renewed discussions around bundling and aggregation. Ultimately, these challenges signal an opportunity as the industry harnesses streaming for long-term business growth.”
CHARTING THE GLOBAL MARKETPLACE:
Big content spends, tapping emerging markets, and automated versioning: these are just a few of the strategies OTT companies are turning to in the fight for dominance in the global marketplace. Stay on top of the business trends and learn about the challenges streamers face with these hand-curated articles from the NAB Amplify archives:
- How To Secure the Next Billion+ Subscribers
- Think Globally: SVOD Success Means More Content, Foreign Content and Automated Versioning
- How Does OTT Gain Global Reach? Here’s Where to Start.
- Governments Draw Battlelines To Curb the US Domination of SVOD
- Streaming Content: I Do Not Think You Know What That Word Means
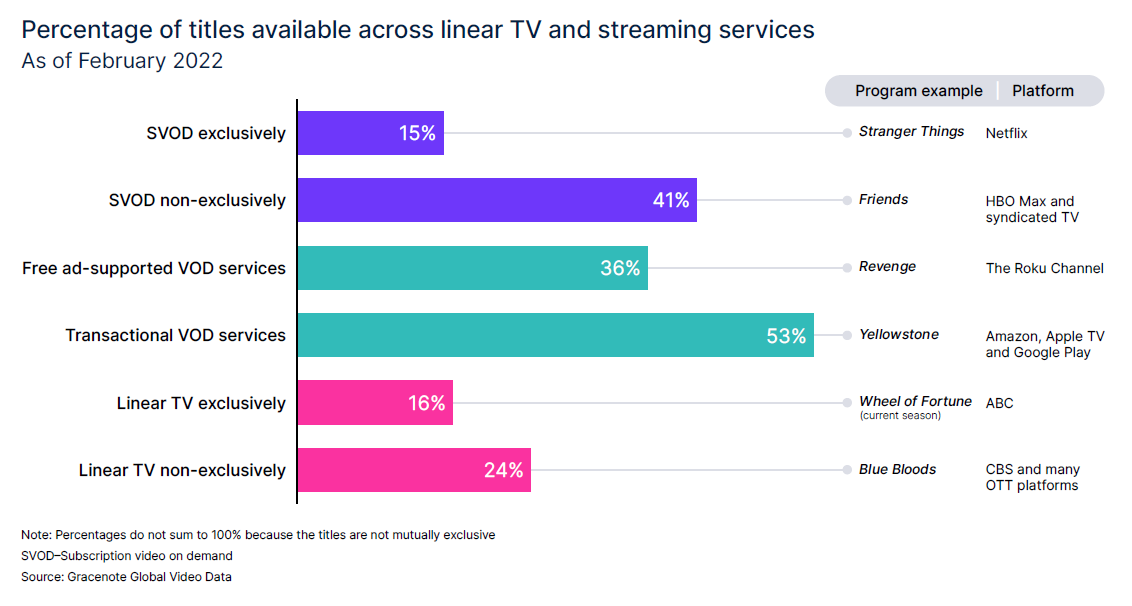
The report shows consumers now have over 817,000 unique program titles as of February 2022 vs. more than 646,000 at December 2019. The increase in content also comes with an increase in consumption, as 18% of Americans are now paying for four streaming services as compared to the 7% who did so in 2019.
When asked about whether bundled streaming services might make it easier for consumers to find the content they are seeking, 64% of respondents indicated they wish there was a bundled video streaming service that would allow them to choose as few or as many video streaming services that they wanted. Nearly half (46%) say that the increase in options makes it challenging to find what they’re looking for.
“The frustration has many wishing for streaming content bundles, somewhat of a pivot from the days when many digital-first consumers were on a pilgrimage to cut the cord from the bundled content offered by cable and satellite services,” suggests Fuhrer.
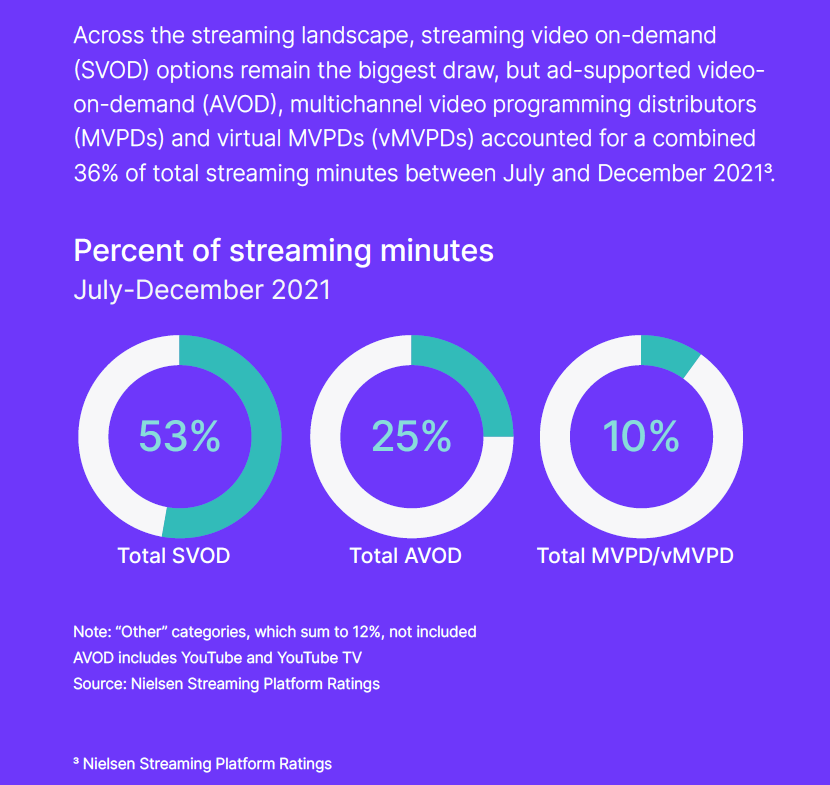
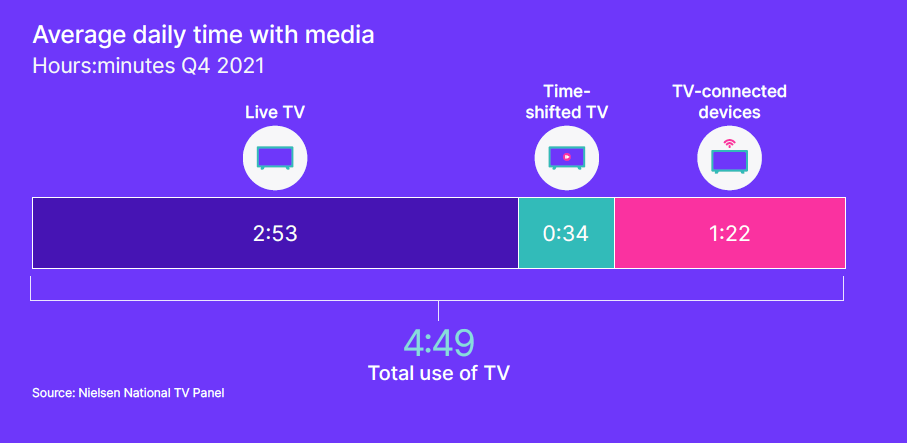
Amid the seemingly overwhelming choices provided by new streaming platforms, SVOD now accounts for 53% of minutes streamed. Of the 4 hours, 49 minutes per day that the average American spends watching content, 1:22 of that is through connected TV (CTV).

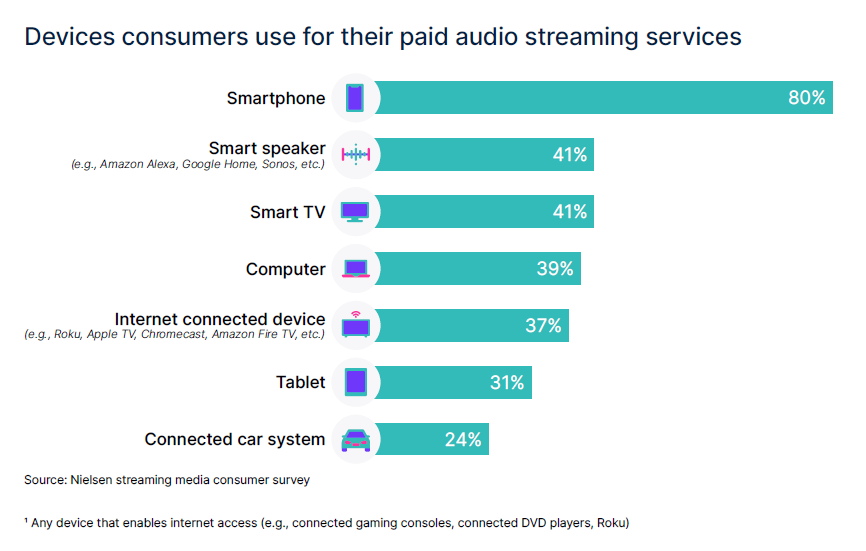
“Despite the growing choice of viewing options, the television set remains the dominant device for reach, but the phrase “watching TV” means much more than it has historically. Today, television sets are simply becoming giant screens — a means of engaging with any and all content, including audio. In fact, smart TVs are as popular for streaming music as smart speakers.”
The average adult we spend more than twice the amount of time watching traditional live programming than content we access through our connected devices, especially with the return of live sports after a tough 2020. Between January and September of last year, 98% of the most viewed broadcast programs were sports, and 72% were across cable programs, engaging consumers for a total of more than 189.5 billion minutes.
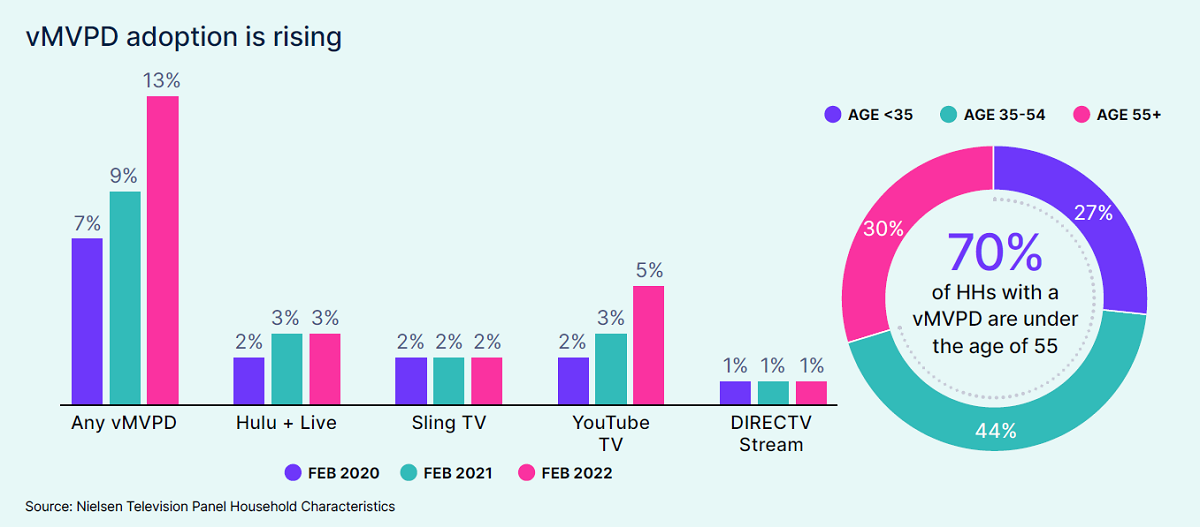
Ad-supported VOD, multichannel video programming distributors (MVPDs) and virtual MVPDs (vMVPDs) have grown to account for 35%. And, the percentage of homes with YouTube TV — the vMVPD with the highest household penetration — has grown by over 160% since 2020.
